ToolAdvisor Logo
ChartGPT Logo

ChartGPT

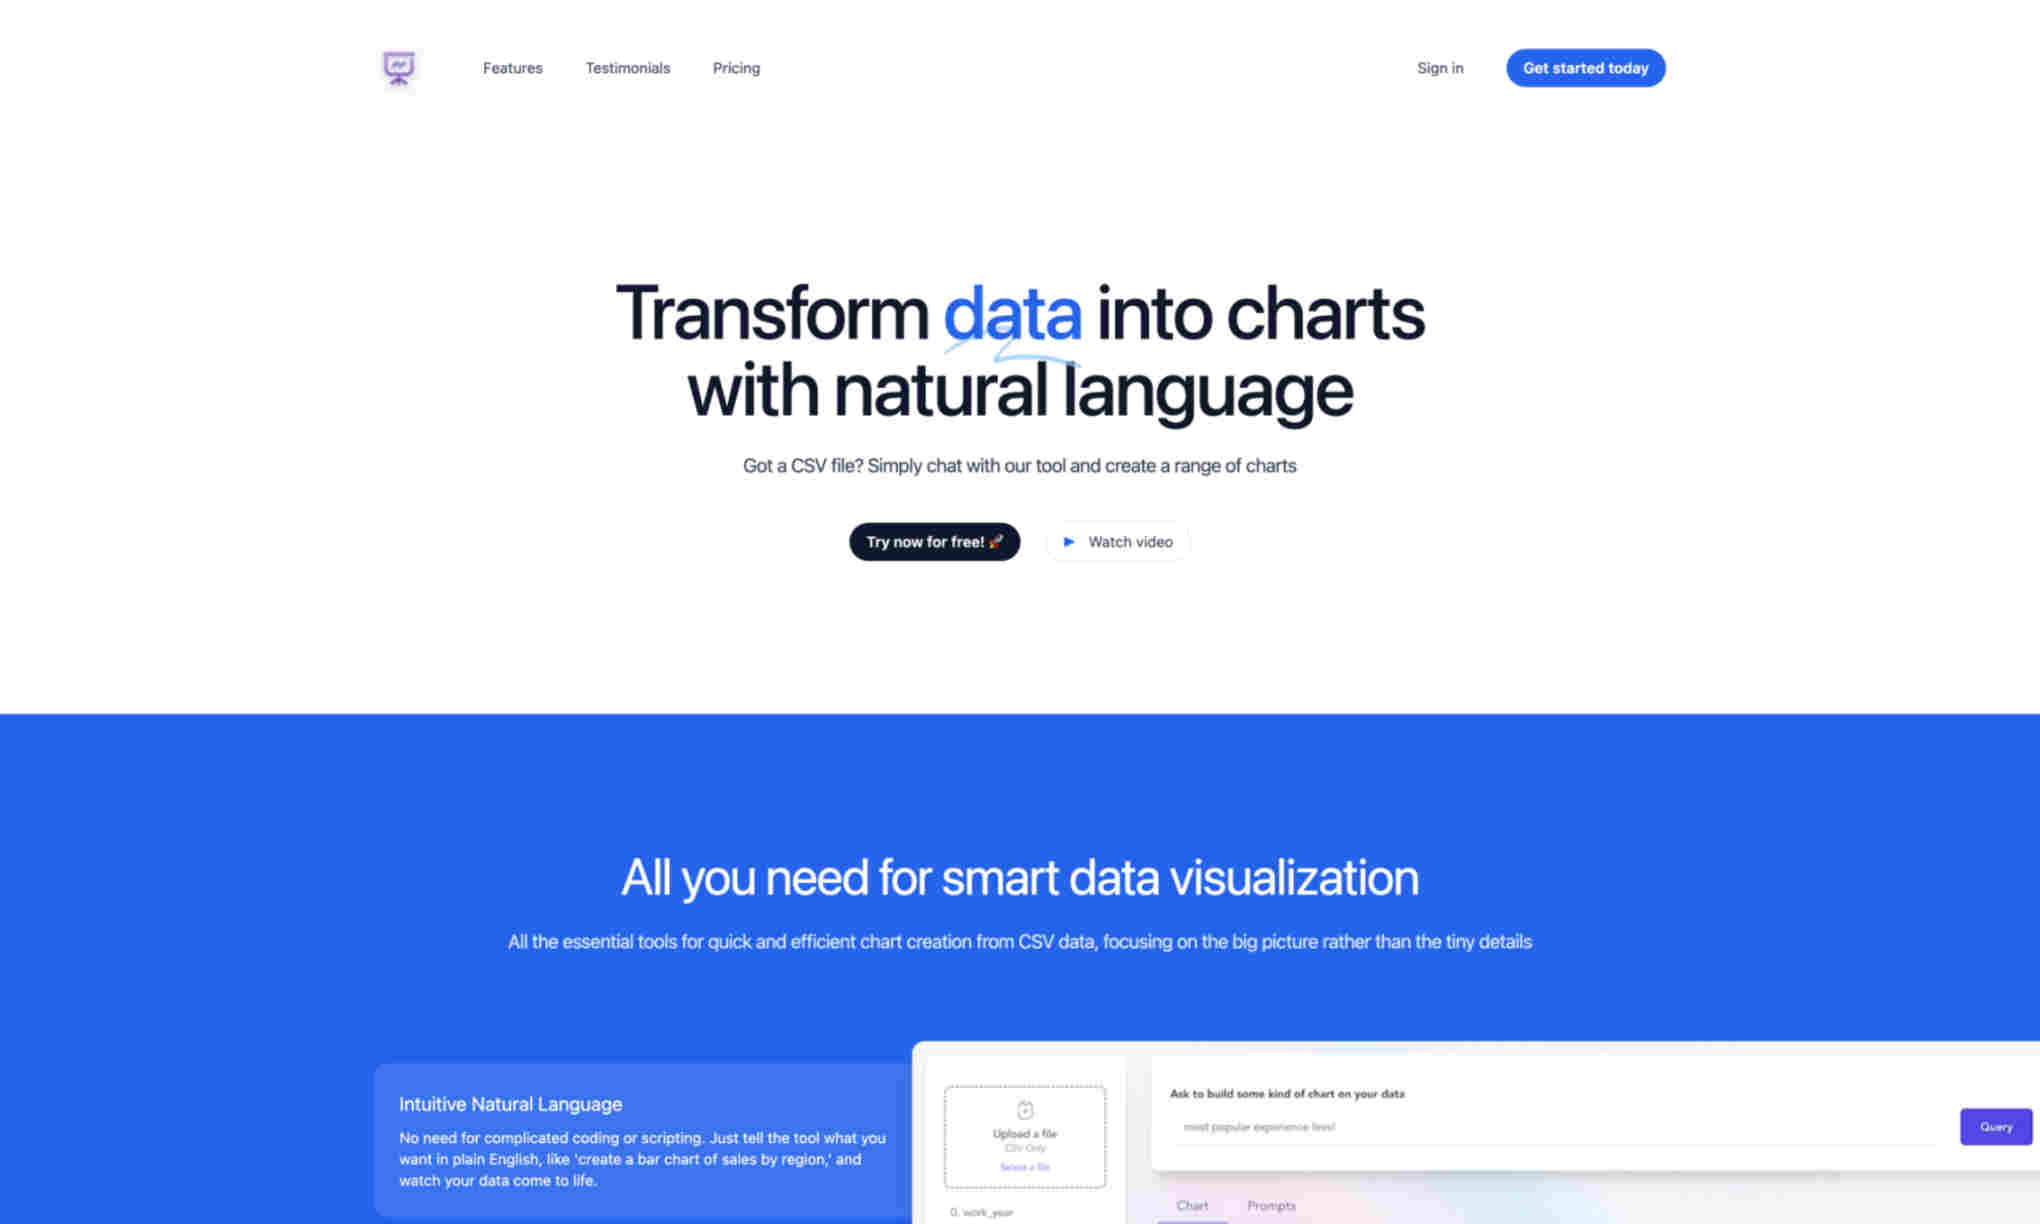
Transform data into charts with natural language.

ChartGPT Homepage

What is ChartGPT?

ChartGPT is a powerful tool for effortless data visualization. It turns CSV files into insightful charts quickly and easily. No coding is required, just natural language input to generate a variety of charts. This makes it user-friendly for those without technical expertise. ChartGPT leverages AI to simplify data interpretation. Users can generate different types of charts with minimal effort. The tool supports diverse visualization needs with wide chart selection. This ensures adaptability for varied data presentation requirements. Privacy and security are at the core of ChartGPT. The tool processes data securely, ensuring user data privacy. It provides peace of mind while delivering efficient analytics. It's a reliable choice for professionals needing secure data handling.

Use Cases

  • Business Analysts: Visualizing sales data trends.
  • Educators: Creating visual aids for teaching statistics.
  • Marketing Teams: Visualizing campaign performance.
  • Financial Analysts: Charting stock market data trends.
  • Researchers: Illustrating survey results.

Key Features

  • Natural Language Processing: Create charts by simply describing them.
  • AI Support: Understands commands and generates charts instantly.
  • Wide Selection of Charts: Numerous chart types for varied needs.
  • Secure Data Handling: Ensures data privacy and security.
  • User-Friendly Interface: Easy navigation without requiring technical skills.
  • Versatile Applications: Suitable for business, research, and education.
  • Real-Time Processing: Quick data analysis and visualization.
  • No Coding Required: Accessible to non-technical users.

Pros

Easy to use: Easy to use with natural language commands.

Quick generation: Quick generation of diverse chart types.

Highly secure: Highly secure data processing.

User-friendly: User-friendly interface.

Versatile: Versatile for various professional needs.

No coding: No coding necessary.

AI-powered: AI-powered for accuracy.

Real-time: Real-time results.

Cons

CSV only: Limited to CSV file input.

Limited customization: May not support complex chart customization.

Supported Languages

English

Contact

  • Email: Not provided.
  • Address:
  • Phone Number:

FAQ

How to use ChartGPT?

close

Using ChartGPT is simple and straightforward. Follow these steps:

  1. Prepare your CSV file with the data you wish to visualize.
  2. Upload the CSV file into the ChartGPT platform.
  3. Describe the chart you want to create using natural language, e.g., 'bar chart of sales revenue by month'.
  4. The AI interprets your request and generates the chart for you.
  5. Review and customize the chart as needed.
  6. Download or share the chart directly from the platform.

What types of charts can I create with ChartGPT?

open

Is my data secure with ChartGPT?

open

Can I use ChartGPT without any coding skills?

open

In which fields can ChartGPT be useful?

open

What file formats does ChartGPT support?

open

Do I need a subscription to use ChartGPT?

open

Can I customize the charts generated by ChartGPT?

open

Is there any limit to the data size I can upload in ChartGPT?

open

Can ChartGPT handle real-time data visualizations?

open

Does ChartGPT offer any customer support?

open

How accurate are the charts generated by ChartGPT?

open

You might also like

Face Swapper Online Logo
Auto Localize Logo
PhotoFairy Canvas Logo
AI canvas
generative AI
Visit Website

Update Time

Link

Link to ChartGPThttps://chat2csv.com

Platform

Website

ToolAdvisor Logo
Contact Us: hello@tooladvisor.ai